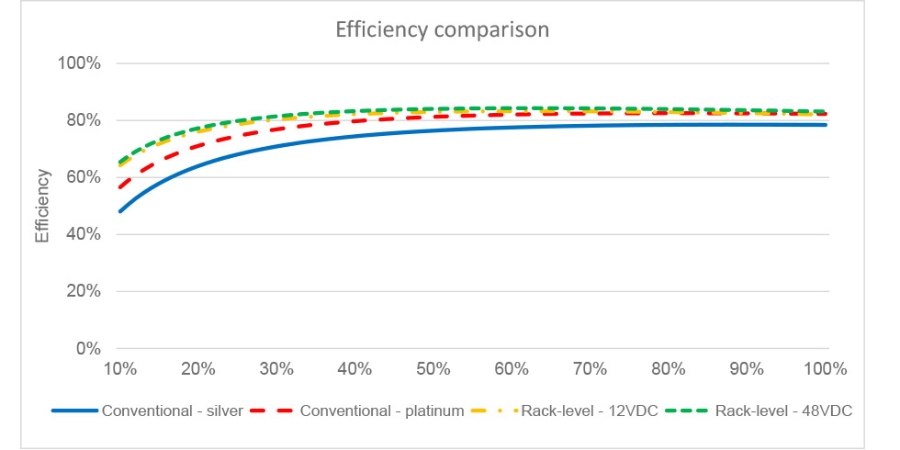
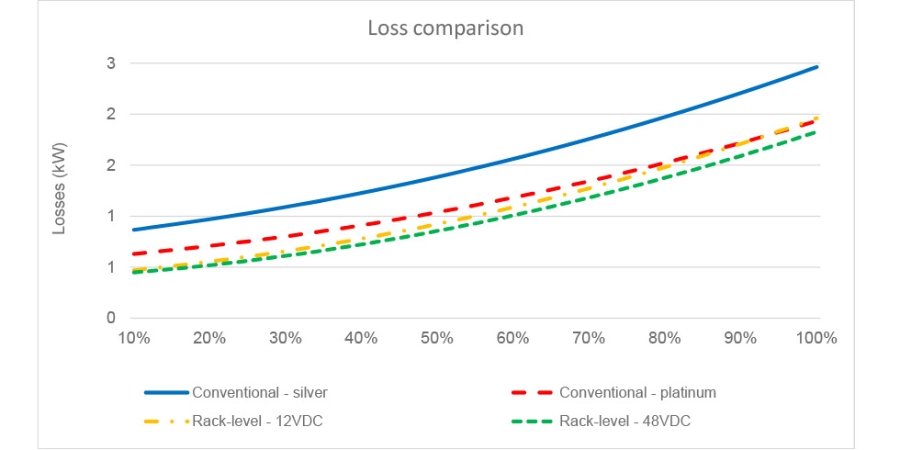
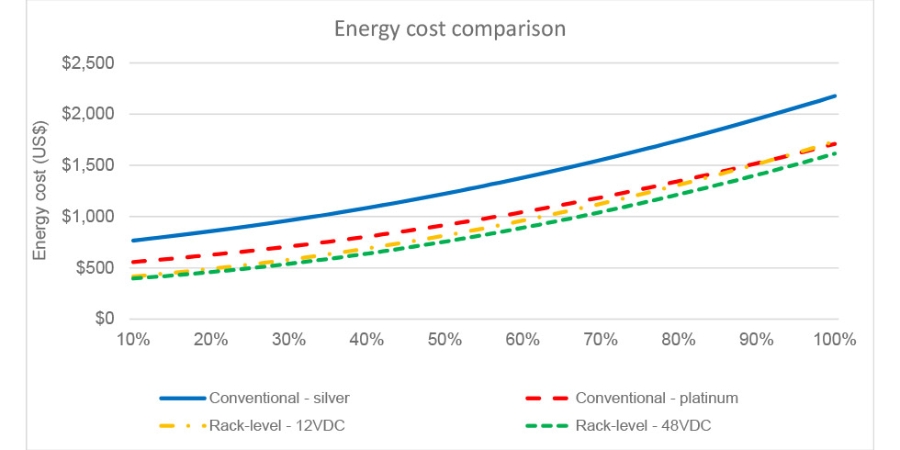
The results above were calculated at 50% load. Figures 8-10 illustrate the performance in efficiency, energy cost, and losses over a range of loads.
White Paper 232 Summary Revision 1 By Rob Bunger and Wendy Torell
White Paper 232 Summary Revision 1 By Rob Bunger and Wendy Torell
Open-source IT systems, like those designed by the Open Compute Project (OCP), are redefining how power is distributed within an IT rack by replacing internal server power supplies with a centralized rack-level power supply. In this paper, we investigate the efficiencies of conventional internal server PSU architectures and centralized rack-level PSU architectures (12VDC and 48VDC). While many believe that consolidating power supplies leads to significant efficiency gains, we found otherwise. With best-in-class components, the consolidated 12VDC rack-level PSU architecture provides a small incremental energy efficiency improvement over the conventional architecture. And consolidating at 48VDC provides another small incremental energy efficiency improvement over 12VDC.
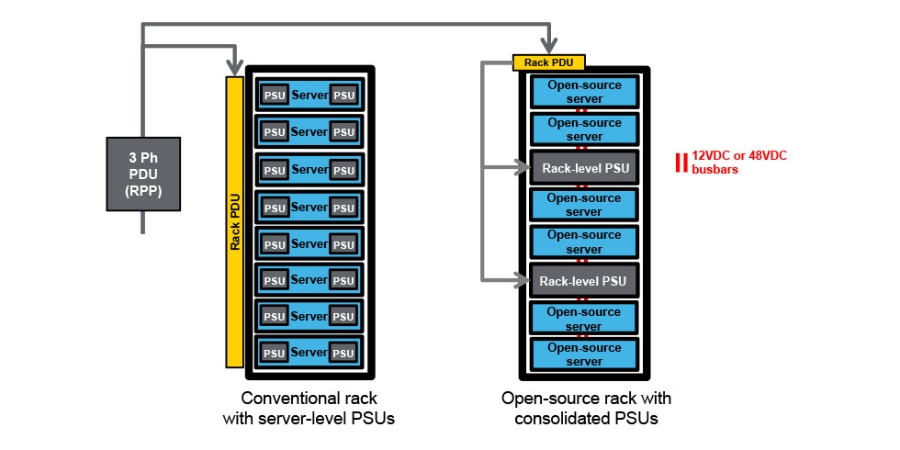
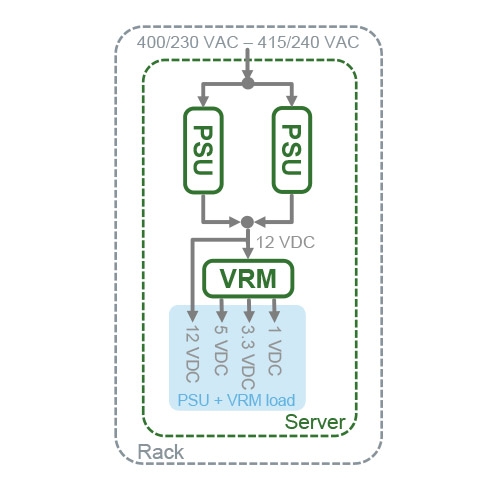
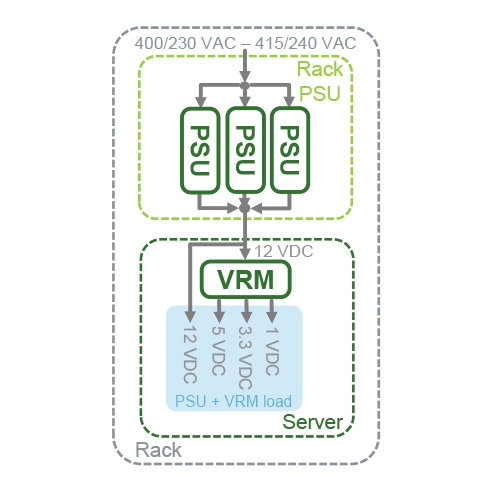
Over the past 10 years, much work has been done to understand and improve the facility electrical infrastructure from utility input to the server. Electrical efficiency inside the server, however, is less understood by end users, with the exception of power supply efficiency which has been governed by the 80Plus certification standard. New rack scale architectures introduced by the Open Compute Project (OCP) as well as Open19, have dis-aggregated the power supply from the information technology equipment (ITE), and consolidated them at the rack level. Figure 1 illustrates a conventional rack of servers, side-by-side with an open-source rack with consolidated PSUs.
In this section, we provide more detailed definitions of three key terms and acronyms used throughout the paper.
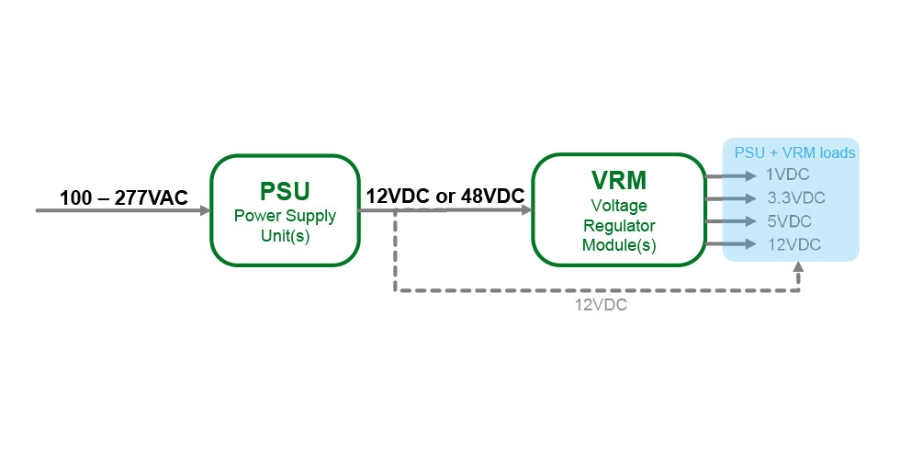
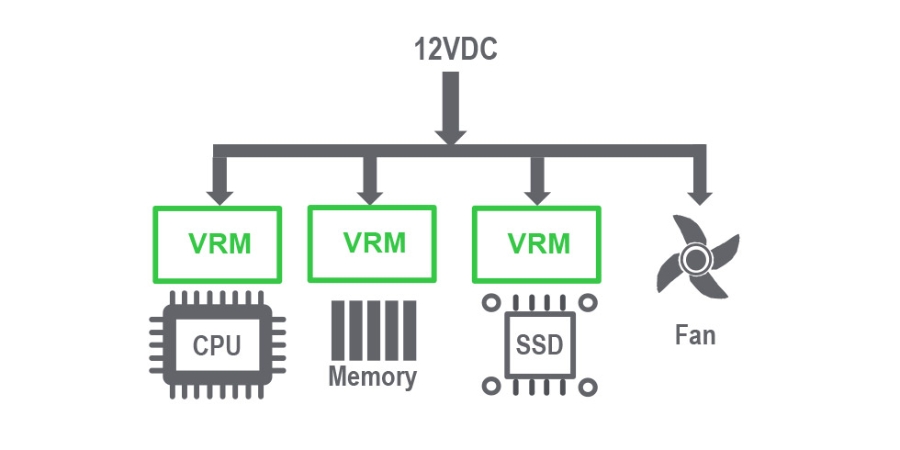
Point of Load (PoL)PoL refers to the components within a server that use power. Examples include the CPU, GPU, memory, HDD storage, SSD storage, and fans. Each component has a specified voltage requirement, typically either 12VDC, 5VDC, 3.3VDC or 1VDC. POLs that require 12VDC can be powered directly from the PSU, as depicted with the dotted line in Figure 2, only in the 12VDC architectures. For 48VDC architectures, the VRM would provide the 12VDC power to the POL. Increasing chip and memory demands are leading to a re-thinking of how PoLs are powered on the motherboard. This is discussed in greater detail in the Appendix of this paper.
Voltage Regulator Modules (VRM)VRMs, also called voltage regulators (VRs), are components within the server that take 12VDC or 48VDC input and convert them into the lower voltages that power the PoLs on the board. 12VDC input VRMs have been the industry standard, but recently (in 2016), 48VDC input modules have been deployed. 48VDC VRMs are currently more expensive, but aid in increasing power density and have improved efficiency. Figure 3 illustrates an example of a VRM configuration.
We analyzed 3 different server power architectures – the conventional power architec-ture that is deployed in the majority of data centers today, and two open-source server power architectures – 12VDC and 48VDC, that offer potential for cost and efficiency savings.
Conventional ITE Architecture
In this commonly deployed architecture (Figure 4), each IT device (i.e. server) is shipped with its own internal power supplies. This allows users to plug the servers directly to the AC source. In this architecture, power supplies typically provide 12VDC to the motherboard for distribution and further conversion.
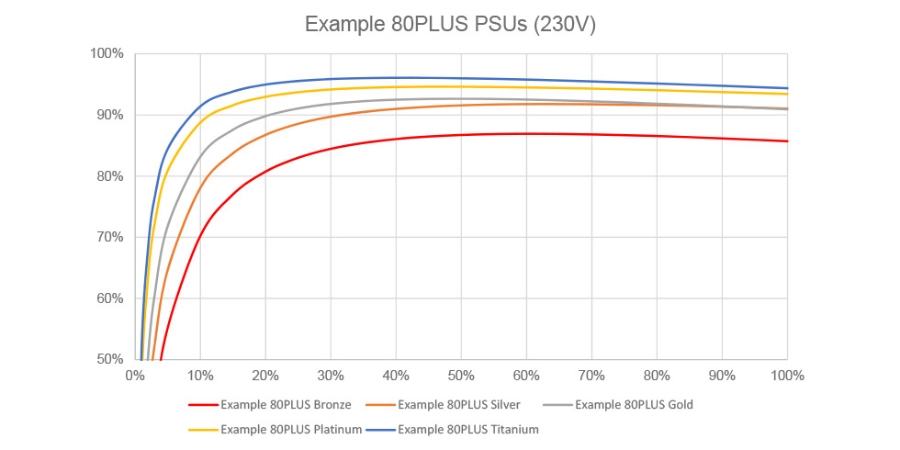
PSUs have had dramatic improvement in efficiencies over the past 10 years, mainly due to the 80Plus certification program. Historically, power supplies were only 80% efficient, while, today, 96% efficient PSUs are available. But even with these highly efficient PSUs, it is rare to see operational efficiency reach this level of performance. This is primarily due to oversizing and redundancy.
Taking these factors into account, server power supplies can be 3x or more oversized compared to the maximum loading. Figure 5 illustrates varying PSU efficiency curves that meet the 80PLUS criteria. Although the peak efficiencies are upwards of 96% in some cases, at light loads (i.e. less than 20%), efficiency begins to drop
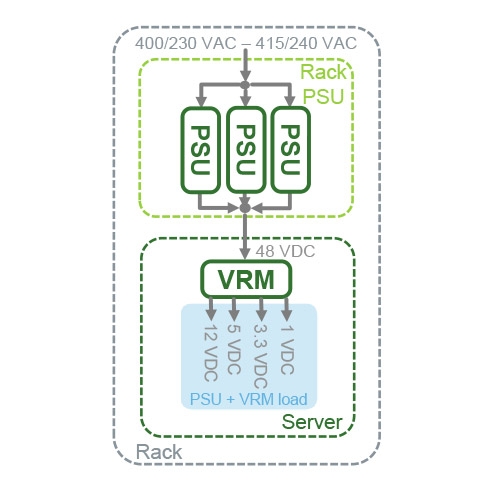
This architecture applies the same principles of the previous 12VDC rack level PSU architecture, but with PSUs that output 48VDC (see Figure 7). In 2016, 48VDC gained attention when Google presented their rack architecture and submitted their design to the Open Compute Project (OCP). The 48VDC voltage option was added to the Open Rack specification in January of 2017. A rack level PSU at 48VDC has the same benefits of 12VDC, but can carry higher power levels at lower losses. The caveat is for the servers to be able to receive 48VDC directly. Board mounted 48VDC to 12VDC step down converters is one architecture, but new regulator technology is allowing greater efficiencies by providing 48VDC to POL voltages directly. In addition to the benefits discussed in the 12VDC rack level architecture, the 48VDC has the following benefits:
To learn more about what’s driving the trend towards 48VDC, see the Appendix.
We analyzed a 10kW rack in order to understand the efficiency and energy cost implications of different server power architectures. We considered the power from the rack input, to the internal components of the IT equipment. This fundamentally includes two main categories of components – Power Supply Units (PSU) and Voltage Regulator Modules (VRMs). We analyzed the 3 architectures described in detail in the previous section. For the conventional ITE with internal power supplies, we analyzed both 80PLUS Silver PSUs and 80PLUS Platinum PSUs.
Methodology
We developed an efficiency model to compute the power path efficiency from the input power of the rack down to the voltage regulator modules (VRMs) within the servers that deliver power to the server components. The key attributes in the analysis are shown in Table 1.
|
Attribute
|
Conventional ITE-level PSU (80PLUS Silver)
|
Conventional ITE-level PSU (80PLUS Platinum)
|
12VDC Rack-level PSU
|
48VDC Rack-level PSU
|
|---|---|---|---|---|
| Computational capacity | 10kW | 10kW | 10kW | 10kW |
| Computational load % | 50% | 50% | 50% | 50% |
| Electricity cost | $0.10/kWh | $0.10/kWh | $0.10/kWh | $0.10/kWh |
| PSU redundancy | 2N (1+1) | 2N (1+1) | N+1 (5+1) | N+1 (5+1) |
| PSU oversizing | 1.5x | 1.5x | 1.2x | 1.2x |
| Peak PSU efficiency | 90% | 94% | 94% | 95% |
| VRM oversizing | 1.1x | 1.1x | 1.1x | 1.1x |
| Peak VRM efficiency | 88% | 88% | 88% | 90% |
| Load % that is 12VDC | 15% | 15% | 15% | 15% |
Computational capacity is the power capacity of the computational components of the servers including the CPU, memory, chipsets, fans, etc. This term has a similar meaning to IT capacity which typically means the rated capacity of the server power supply units (PSU) for conventional architectures but for rack-level PSU architectures, this means the rated capacity of the voltage regulator modules (VRMs) within the server. In this analysis, we use computational load of 10kW across all three architectures, so that we can fairly compare the differences in efficiency performance.
Computational load is the percentage of the computational capacity that is currently loaded. This load defines where the modeled 10kW data center is operating on its efficiency vs load curve. For this analysis, we used 50% loading, which is typical of many data centers.
Electricity cost per kWh is used to compute the annual energy cost associated with the losses of each architecture. We used the US average rate of $0.10/kWh.
PSU redundancy is typically 2N for conventional ITE PSUs, meaning two units share the load equally instead of one unit that could potentially be fully loaded to capacity. For rack-level PSUs, it is typical to have N+1 PSU redundancies, though 2N and N are sometimes considered as alternatives. We assumed 2N for the ITE PSUs and N+1 for the rack-level PSUs.
PSU oversizing is used to determine the ratio of the rated power capacities of PSUs to VRMs. Server PSUs are generally oversized in capacity by at least a factor of 1.5 so that they never endure a full load, but most typically by a factor of 2-3 at 1N (as discussed earlier). The oversizing and redundancy combined result in excess PSU capacity which is shown as a percentage of the required PSU capacity. For the conventional ITE level PSU architecture, we used a conservative oversizing factor of 1.5x, whereas for the consolidated rack-level PSUs, we used an oversizing of 1.2x.
Peak server PSU efficiency is the maximum efficiency expected from the PSU. We assumed 90% for the conventional server-level PSUs, which is a realistic value for servers today, given the 80PLUS standards. For the 12V rack-level PSU, we expect an efficiency improvement, and assumed a peak efficiency of 94%. And for the 48VDC rack-level PSU, where we expect further efficiency gains (less i2R losses at higher voltages), we assumed 95%. PSU efficiencies are based on Schneider Electric’s 12VDC PSU solution.
VRM oversizing – We assume the VRMs are oversized in rated power capacity by a factor of 1.1x the computational load.
Peak server VRM efficiency is the maximum efficiency of the voltage regulators within the servers of each architecture. This value represents the weighted average of the efficiencies required for each voltage rail. We derived a value of 88%, based on data from the most common VRMs built today. For the 48VDC VRM, we assume a 2% improvement over 12VDC, or a peak efficiency of 90%. This accounts for the higher efficiencies reached by VRMs that accept 48VDC power.
Load % that is 12VDC is used to “weight” the losses of the VRM. We use a typical value of 15% in our analysis. This means, 85% of the load goes through the 12VDC VRMs, and 15% does not. In the case of the 48VDC architecture, all POLs are fed from the VRMs.
In our analysis, we made some simplifying assumptions worth noting.
Upstream power and cooling – This analysis excludes all losses from the upstream power and cooling infrastructure that supports these rack architectures. While not insignificant, these losses would be similar across architectures, and therefore have no significant impact to the efficiency and energy cost differences between designs.
Busbars – From the rack input to the PoLs, power travels through cables, connectors and busbars in addition to the power conversion devices we’ve previously discussed. When properly sized, efficiency losses are negligible through these components and are ignored in this study. As an example, an 800mm x 80mm x 3.5mm copper busbar, designed to carry 600 amps will see 0.25% efficiency loss at maximum load.
|
Result
|
Conventional ITE-level PSU (80PLUS Silver)
|
Conventional ITE-level PSU (80PLUS Platinum)
|
12VDC Rack-level PSU
|
48VDC Rack-level PSU
|
|---|---|---|---|---|
| Excess PSU capacity | 200% | 200% | 44% | 44% |
| Efficiency (%) | 76.4% | 81.3% | 83.0% | 84.1% |
| Losses (kW) | 1.39kW | 1.038kW | 0.92 kW | 0.86kW |
| Annual energy cost ($US) | $1224 | $917 | $816 | $756 |
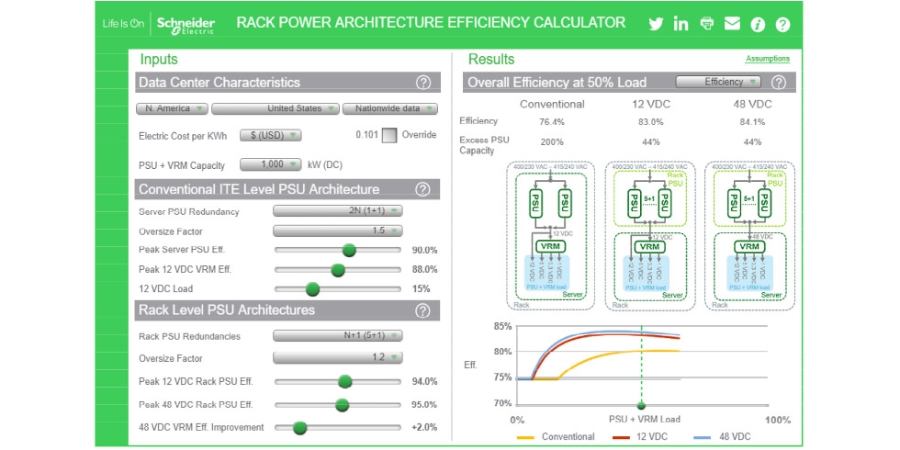
We developed an online TradeOff Tool (see Figure 11) to demonstrate the efficiency differences between the conventional and rack-level PSU architectures, called the Rack Power Architecture Efficiency Calculator. With this tool, the user can adjust key parameters such as redundancy of PSUs, peak efficiencies of PSUs and VRMs, oversizing factors, and energy cost/kWh, to see how they impact the overall architec-ture efficiency, energy cost, and power losses.
The tool helps illustrate the expected ranges in efficiency performance over a range of operating conditions (load, PSU redundancy, etc.), and helps illustrate the drivers to efficiency improvement (component efficiency, oversizing, and redundancy).
Organizations like the Open Compute Project (OCP) and Open19 have created open-source alternatives to conventional server designs. They are redefining how power is converted and distributed within an IT rack by replacing internal server PSUs with centralized rack-level PSUs. 12VDC has been the standard output for power supplies, but recently we’re hearing buzz about 48VDC, with claims of much higher overall efficiency.
We analyzed the efficiencies of the conventional ITE-level PSU architecture (with 80PLUS silver power supplies and 80PLUS platinum power supplies), 12VDC rack-level PSU architecture, and 48VDC rack-level PSU architecture to quantify the energy implications and better understand the differences and drivers.
We found the 12VDC rack-level architecture improved energy efficiency by 2-7 percentage points over the conventional approach, depending on the server’s PSU efficiency; And the 48VDC rack-level architecture improved efficiency by 1 percentage point over the 12VDC rack-level approach.
Although PSU redundancy and oversizing vary between the conventional and rack-level architectures, they were found NOT to be key drivers. The reason for this is the overall improvement in PSU efficiencies over the years. Redundancy and oversizing impact where you are on the efficiency curve, but today’s efficiency curves are flatter, meaning even at lighter loads, they perform fairly well.
We created an online tool to illustrate the differences between the architectures, show the main drivers of the electrical losses, and see how varying parameters like redun-dancy of PSUs, oversizing of PSUs, and component efficiencies can impact the resulting overall efficiency.
We believe with the marginal efficiency gains of 12VDC rack-level PSU architectures, but reasonable capex improvements over conventional designs, we will see an increase in adoption of this approach. And we’d expect that 12VDC is the likely architec-ture for near future, with 48VDC gaining ground as density requirements rise and costs decline.
Robert Bunger is the Director of Data Center Industry Alliances at Schneider Electric. In his 20 years at Schneider Electric, Robert has held management positions in customer service, technical sales, offer management, and business development. While with APC / Schneider Electric, he has lived and worked in the US, Europe, and China. Prior to joining APC, he was a commissioned officer in the US Navy Submarine force for 8 years. Robert has a BS in Computer Science from the US Naval Academy and MS EE from Rensselaer Polytechnic Institute.
Wendy Torell is a Senior Research Analyst at Schneider Electric’s Data Center Science Center. In this role, she researches best practices in data center design and operation, publishes white papers & articles, and develops TradeOff Tools to help clients optimize the availability, efficiency, and cost of their data center environments. She also consults with clients on availability science approaches and design practices to help them meet their data center performance objectives. She received her Bachelors of Mechanical Engineering degree from Union College in Schenectady, NY and her MBA from University of Rhode Island. Wendy is an ASQ Certified Reliability Engineer.
Analysis of Data Center Architectures Supporting Open Compute Project (OCP) Designs > White Paper 228
Browse all white papers > whitepapers.apc.com
Rack Power Architecture Efficiency Calculator > TradeOff Tool 20
Traditional vs. OCP Power Architecture Capex Comparison > TradeOff Tool 18
Browse all TradeOff Tools™ > tools.apc.com
For feedback and comments about the content of this white paper:
If you are a customer and have questions specific to your data center project:
Recent trends driving 48VDC to the server
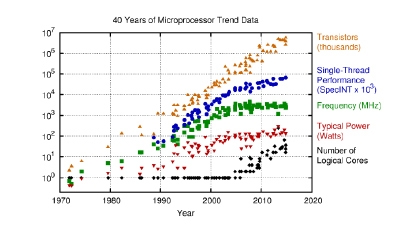
The chart in Figure A1 from Google highlights the last 40 years of chip performance. It illustrates the various levers in the design of a CPU that can improve compute performance. The blue line shows the single-thread performance over time, and continues to trend up. There are three main ways to increase chip performance:
Historically, a constraint was put on the CPU package power at around 150W (the red points on the chart), primarily because it wasn’t necessary to go beyond this to achieve the compute performance needs, and it was a sensible threshold for air-cooling a 1U server.
Although new processor technologies continue to increase the frequency, transistor count, and number of cores, they are not doing so at the rate demanded by certain workloads. As a result, people are now willing to consider a CPU package power increase to achieve the desired performance. This will cause an eventual upward trend in the red data points in the chart. With trends like machine learning and AI, GPUs are growing in popularity, and non-conventional form factors (i.e. with giant heat sinks), and liquid cooling are becoming accepted.
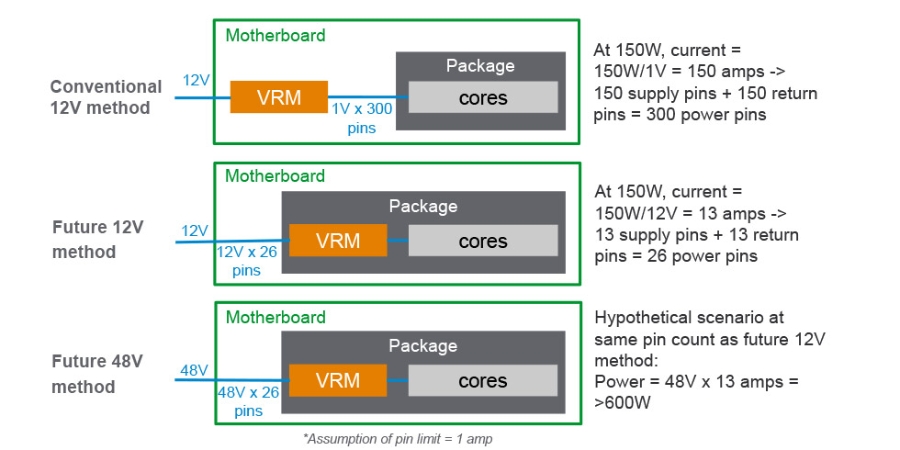
As Figure A2 illustrates, voltage conversion today commonly takes place on the motherboard, with VRMs sending power through many 1VDC pins to the chip package. Consider the common scenario today – a 12VDC input to the VRMs and a 150W chip power requirement. With the assumption of a 1-amp pin limit, this design would require 300 1VDC power pins on the motherboard to provide that power. Physical limits exist that constrain us from increasing the chip power with this approach.
To overcome this, we are headed towards VRMs integrated right on the chip package. When this occurs, we can significantly reduce the number of pins by increasing the voltage. Consider a future scenario of 12VDC, with that same 150W chip requirement. Because you can send the 12VDC directly to the chip package, you can now meet this requirement with 26 pins, a significant reduction in pin count on the board.