Issue:
Monitoring alarms on NetBotz using Modbus.
Product Line:
NetBotz
Environment:
NetBotz 550
NetBotz 570
NetBotz 450 (with Advanced Software Pack)
NetBotz 455 (with Advanced Software Pack)
Cause:
This is just a guide showing how to monitor NetBotz events using Modbus. Modbus output is not available on the 4xx units by default.
Resolution:
In this example, I have configured a NetBots 570 with a rack access pod NBPD0171. I want to see when there is a forced entry into a rack door being monitored by this NetBotz configuration. Any supported firmware should work but in this case, I have used version 4.5.2.
There is no way using Modbus to know the exact error message. Based on the return values and the register maps, you can tell what sensor is in an error state and you can tell what level of event is occurring. Let me first state that this mimics the DCE modbus output and you can use the following document (at least the beginning of it) to figure out the level of alarm:
https://www.apc.com/us/en/download/document/SPD_JRUK-7R4L9N_EN/
This is app note 156 and the link may change over time.
First, Enable the Modbus output on the “Modbus Slave Communications” applet in NetBotz Advanced View (AV). On a 4xx unit, you must first install the advanced software pack. On a 5xx unit, this is enabled by default. 3xx units and older version 2 units does not support this feature.
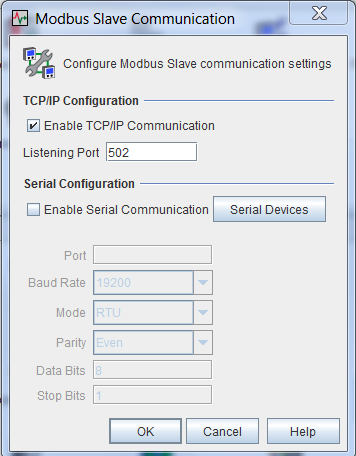
This example is using Modbus over TCP but there is a serial option. Please see the user manual for your unit as to how to use the serial connections.
Next, using the ”Modbus Slave System” applet in AV, find the appropriate pod. In this case, I am using Rack Access Pod 170 (03)
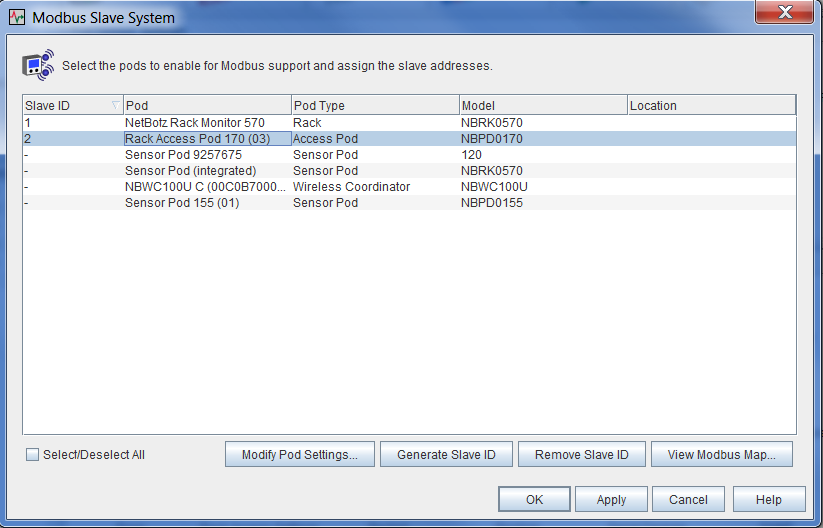
Click “Modify Pod Settings” and you will be able to give the pod a slave address and create a register map for all it’s sensors:
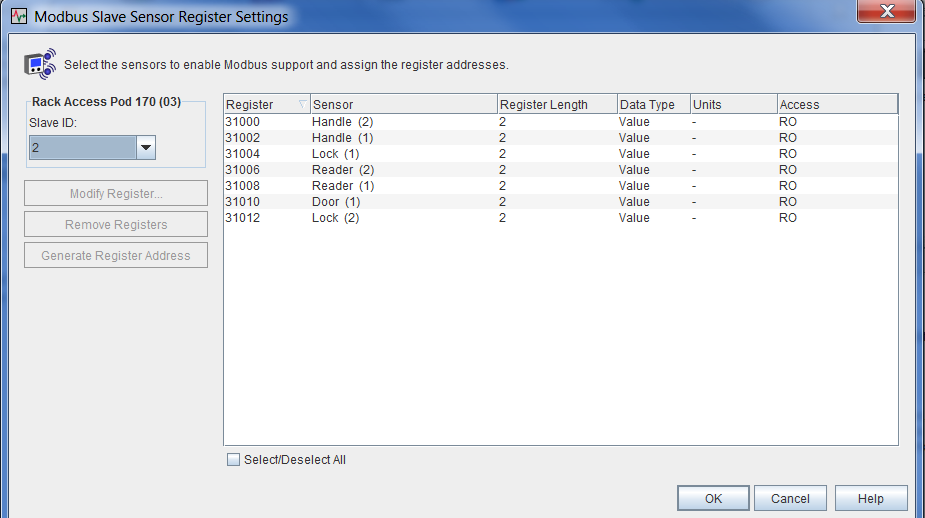
After this configuration, you can view and subsequently export the register map back on the “Modbus Slave System” page.
You will see the alarms configured this way (and more):
all 30992(0x7910) Alarm #03 002 UINT16 RO Alarm - Alarm Code + Corresponding Sensor
all 30994(0x7912) Alarm #02 002 UINT16 RO Alarm - Alarm Code + Corresponding Sensor
all 30996(0x7914) Alarm #01 002 UINT16 RO Alarm - Alarm Code + Corresponding Sensor
You will also see each pod as it’s own slave. Here you can see the main unit as slave 1 and the NetBotz 170 pod as slave 2:
001 31000(0x7918) NetBotz Rack Monitor 570:Ethernet Link Status 002 INT16 RO Value - 0(Down), 1(Up)
001 31002(0x791a) NetBotz Rack Monitor 570:A-Link Bus Power 002 INT16 RO Value - 0(OK), 1(Overloaded)
002 31000(0x7918) Rack Access Pod 170 (03):Handle (2) 002 INT16 RO Value - 0(Up), 1(Down)
002 31002(0x791a) Rack Access Pod 170 (03):Handle (1) 002 INT16 RO Value - 0(Up), 1(Down)
002 31004(0x791c) Rack Access Pod 170 (03):Lock (1) 002 INT16 RO Value - 0(Unlocked), 1(Locked)
002 31006(0x791e) Rack Access Pod 170 (03):Reader (2) 002 INT16 RO Value - 0(Disabled), 1(Enabled)
002 31008(0x7920) Rack Access Pod 170 (03):Reader (1) 002 INT16 RO Value - 0(Disabled), 1(Enabled)
002 31010(0x7922) Rack Access Pod 170 (03):Door (1) 002 INT16 RO Value - 0(Open), 1(Closed)
002 31012(0x7924) Rack Access Pod 170 (03):Lock (2) 002 INT16 RO Value - 0(Unlocked), 1(Locked)
Please note that each register is actually listed as 2 numbers higher than the last. This is because each sensor is configured as 2 registers. If you're looking for data on a specific register say 31000, you actually have to pull 31000 and 31001. Note the register in bold is 31010. To get the data for this sensor, you need to pull 31010 and 31011. It also shows this is the door sensor and the value should be 0 for open and 1 for closed. Knowledge base FA214410 can assist if you’re unsure how to use dual registers but it should not be necessary in this specific instance.
Next, when you poll for alarms, you poll register 30999. This shows how many alarms there are. Register 30998 shows the highest severity of the alarms if there are multiple. For each alarm, you should read 2 registers back. In this case there is 1 alarm so reading 2 registers before the 30998 is 30997 and 30996.
In this image from AV, you can see the door is open and in an error state:
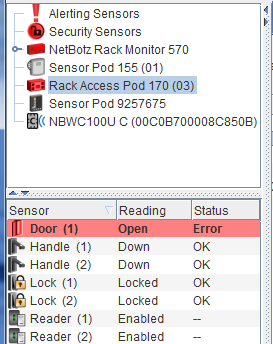
Upon polling the device’s IP and slave address 2, you can see that 31010 and 31011 (31011 is the important one) is reading 0. This means from the register map that the door is open. Value - 0(Open), 1(Closed)
Here is what that same register looks like if I close the door:

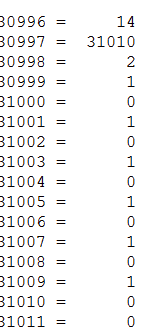
Putting the door back in alarm, you can see that 30999 is 1 meaning there is 1 error and 30998 is 2 which means it is level 2 (error)....the latter is defined in the DCE app note 156 linked above.

The register 30997 above reports the sensor. The return is 31010. This matches the register on that door sensor as shown in the register map. The register 30996 reports the actual error. This is also defined in the DCE app note. It's in HEX in the app note so you have to show the return in hex as I am doing here:
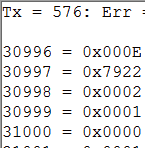
Note that 30996 is reporting 000E. If you check the device alarm codes here (again from app note 156), you'll see that 000E relates to "General Device Alarm":
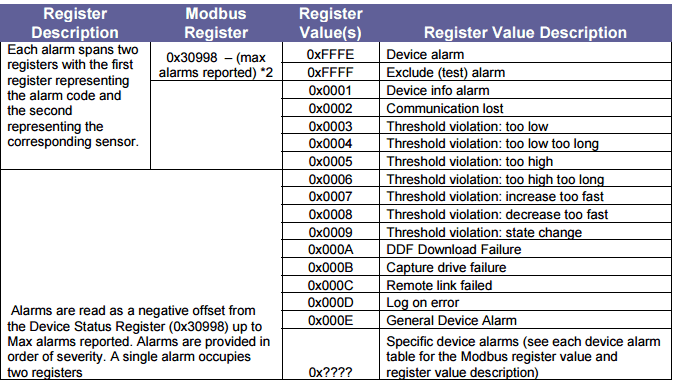
So with this information, I opened a door with a locked handle and the information I pulled via Modbus shows that sensor (register) 31010 is in an alarm state of general device alarm and it is an error level. Looking at the register map I can tell that 31010 (remember, it's 2 registers on a sensor) is a door sensor and since it's return is 0, the door is open. You can also check the other sensors such as handle to see if it is down or check the lock to ensure it is locked etc.
Monitoring alarms on NetBotz using Modbus.
Product Line:
NetBotz
Environment:
NetBotz 550
NetBotz 570
NetBotz 450 (with Advanced Software Pack)
NetBotz 455 (with Advanced Software Pack)
Cause:
This is just a guide showing how to monitor NetBotz events using Modbus. Modbus output is not available on the 4xx units by default.
Resolution:
In this example, I have configured a NetBots 570 with a rack access pod NBPD0171. I want to see when there is a forced entry into a rack door being monitored by this NetBotz configuration. Any supported firmware should work but in this case, I have used version 4.5.2.
There is no way using Modbus to know the exact error message. Based on the return values and the register maps, you can tell what sensor is in an error state and you can tell what level of event is occurring. Let me first state that this mimics the DCE modbus output and you can use the following document (at least the beginning of it) to figure out the level of alarm:
https://www.apc.com/us/en/download/document/SPD_JRUK-7R4L9N_EN/
This is app note 156 and the link may change over time.
First, Enable the Modbus output on the “Modbus Slave Communications” applet in NetBotz Advanced View (AV). On a 4xx unit, you must first install the advanced software pack. On a 5xx unit, this is enabled by default. 3xx units and older version 2 units does not support this feature.
This example is using Modbus over TCP but there is a serial option. Please see the user manual for your unit as to how to use the serial connections.
Next, using the ”Modbus Slave System” applet in AV, find the appropriate pod. In this case, I am using Rack Access Pod 170 (03)
Click “Modify Pod Settings” and you will be able to give the pod a slave address and create a register map for all it’s sensors:
After this configuration, you can view and subsequently export the register map back on the “Modbus Slave System” page.
You will see the alarms configured this way (and more):
all 30992(0x7910) Alarm #03 002 UINT16 RO Alarm - Alarm Code + Corresponding Sensor
all 30994(0x7912) Alarm #02 002 UINT16 RO Alarm - Alarm Code + Corresponding Sensor
all 30996(0x7914) Alarm #01 002 UINT16 RO Alarm - Alarm Code + Corresponding Sensor
You will also see each pod as it’s own slave. Here you can see the main unit as slave 1 and the NetBotz 170 pod as slave 2:
001 31000(0x7918) NetBotz Rack Monitor 570:Ethernet Link Status 002 INT16 RO Value - 0(Down), 1(Up)
001 31002(0x791a) NetBotz Rack Monitor 570:A-Link Bus Power 002 INT16 RO Value - 0(OK), 1(Overloaded)
002 31000(0x7918) Rack Access Pod 170 (03):Handle (2) 002 INT16 RO Value - 0(Up), 1(Down)
002 31002(0x791a) Rack Access Pod 170 (03):Handle (1) 002 INT16 RO Value - 0(Up), 1(Down)
002 31004(0x791c) Rack Access Pod 170 (03):Lock (1) 002 INT16 RO Value - 0(Unlocked), 1(Locked)
002 31006(0x791e) Rack Access Pod 170 (03):Reader (2) 002 INT16 RO Value - 0(Disabled), 1(Enabled)
002 31008(0x7920) Rack Access Pod 170 (03):Reader (1) 002 INT16 RO Value - 0(Disabled), 1(Enabled)
002 31010(0x7922) Rack Access Pod 170 (03):Door (1) 002 INT16 RO Value - 0(Open), 1(Closed)
002 31012(0x7924) Rack Access Pod 170 (03):Lock (2) 002 INT16 RO Value - 0(Unlocked), 1(Locked)
Please note that each register is actually listed as 2 numbers higher than the last. This is because each sensor is configured as 2 registers. If you're looking for data on a specific register say 31000, you actually have to pull 31000 and 31001. Note the register in bold is 31010. To get the data for this sensor, you need to pull 31010 and 31011. It also shows this is the door sensor and the value should be 0 for open and 1 for closed. Knowledge base FA214410 can assist if you’re unsure how to use dual registers but it should not be necessary in this specific instance.
Next, when you poll for alarms, you poll register 30999. This shows how many alarms there are. Register 30998 shows the highest severity of the alarms if there are multiple. For each alarm, you should read 2 registers back. In this case there is 1 alarm so reading 2 registers before the 30998 is 30997 and 30996.
In this image from AV, you can see the door is open and in an error state:
Upon polling the device’s IP and slave address 2, you can see that 31010 and 31011 (31011 is the important one) is reading 0. This means from the register map that the door is open. Value - 0(Open), 1(Closed)
Here is what that same register looks like if I close the door:
Putting the door back in alarm, you can see that 30999 is 1 meaning there is 1 error and 30998 is 2 which means it is level 2 (error)....the latter is defined in the DCE app note 156 linked above.
The register 30997 above reports the sensor. The return is 31010. This matches the register on that door sensor as shown in the register map. The register 30996 reports the actual error. This is also defined in the DCE app note. It's in HEX in the app note so you have to show the return in hex as I am doing here:
Note that 30996 is reporting 000E. If you check the device alarm codes here (again from app note 156), you'll see that 000E relates to "General Device Alarm":
So with this information, I opened a door with a locked handle and the information I pulled via Modbus shows that sensor (register) 31010 is in an alarm state of general device alarm and it is an error level. Looking at the register map I can tell that 31010 (remember, it's 2 registers on a sensor) is a door sensor and since it's return is 0, the door is open. You can also check the other sensors such as handle to see if it is down or check the lock to ensure it is locked etc.

